B2B SaaS websites get fewer visitors today than they did two years ago. However those visitors arrive with much higher intent.
Generative Engine Optimization (GEO) and AI Engine Optimization (AEO) have rewired the traffic profile. SaaS brands now surface inside ChatGPT, Perplexity, and Google AI Overviews.
Visitors who click through land late in their buying journey. They already know the category and the competitive set. Conversion rate optimization now sits at the center of B2B SaaS marketing strategy.
CRO for B2B SaaS is the structured practice of using behaviour data and controlled experiments to lift conversion on existing qualified traffic. The work involves 3 things:
- Analyzing visitor behaviour.
- Removing friction from high-intent pages.
- Testing targeted page changes.
The objective is not to grow traffic. The objective is to convert more of the traffic already arriving. A weak pricing page or a buried demo form leaks revenue every day. This guide breaks down the CRO framework, the friction-analysis tactics, and the on-page changes B2B SaaS teams can ship in the next sprint.
Why Traditional CRO Advice No Longer Works
Most CRO advice assumes you're working with high traffic, fast decisions, and clean attribution, and you'll find the same suggestions everywhere: run A/B tests, optimize CTAs, reduce form fields, chase a 2% lift.
It works beautifully if you're selling sneakers. It falls apart the moment you apply it to a B2B SaaS demo page with 800 monthly visits and a 90-day sales cycle. The advice isn't wrong, it's just built for a different game.
1. SaaS CRO Differs From E-commerce CRO
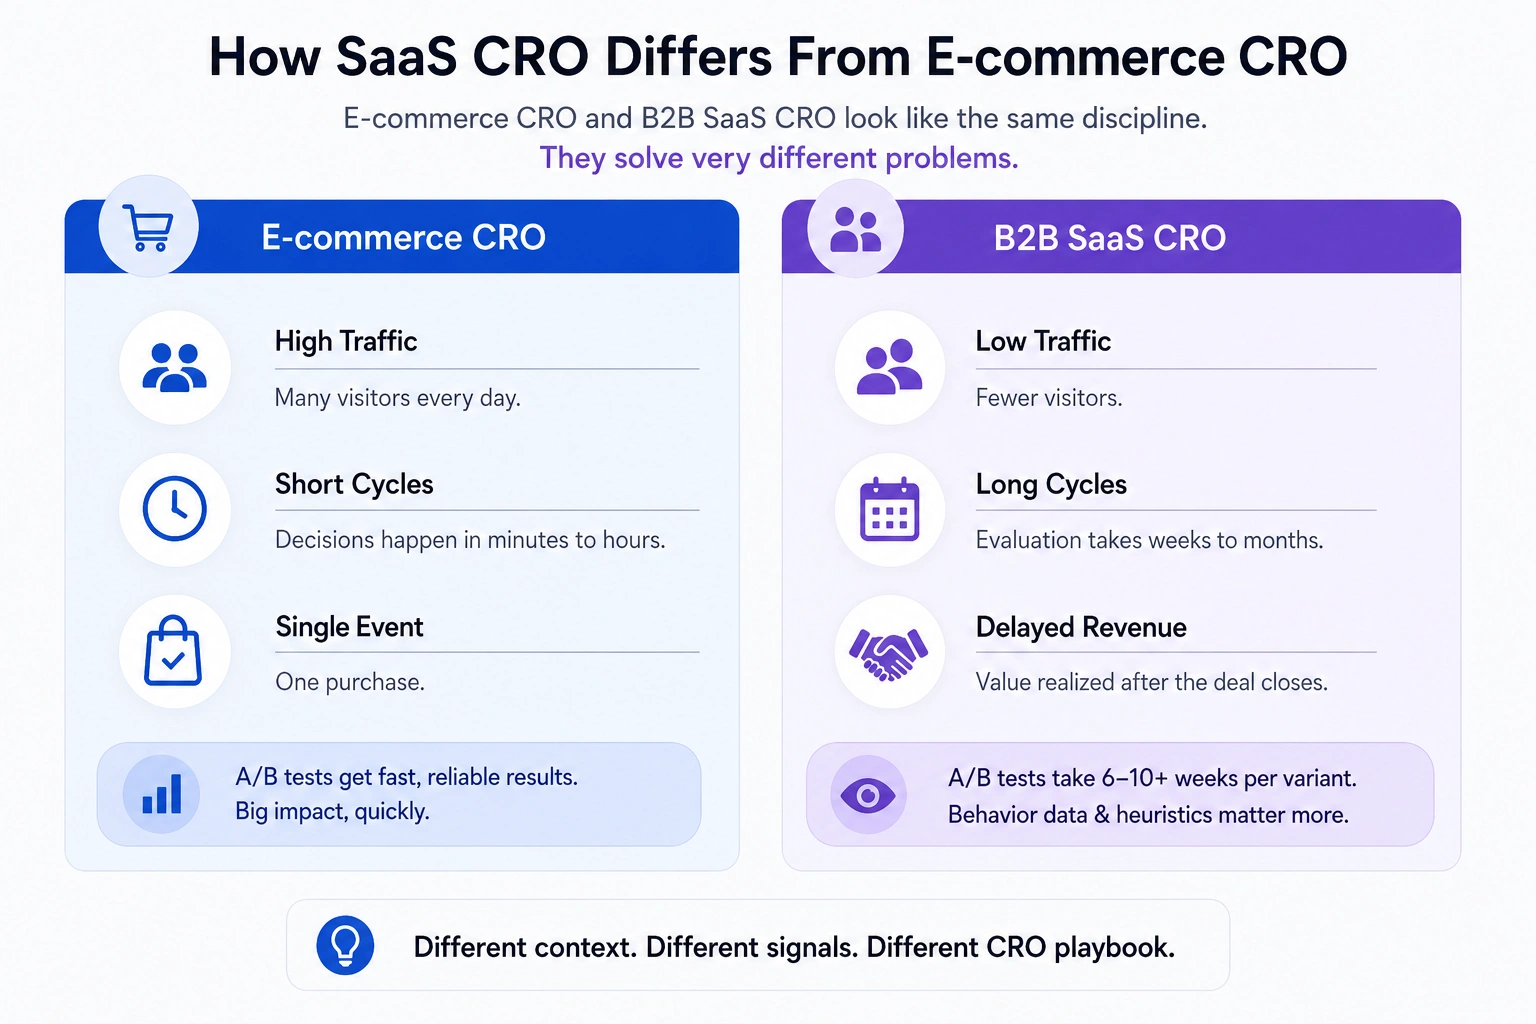
E-commerce and B2B SaaS CRO look alike but solve different problems. E-commerce and B2B SaaS CRO look alike but solve different problems.
E-commerce thrives on high traffic and quick purchases; B2B SaaS deals with low traffic, long evaluation cycles, and revenue tied to deals that close well after the click.
The gap between these two disciplines shows up clearly in the data. Unbounce's analysis of 41,000 landing pages found the median SaaS landing page converts at 3.8%. That is the lowest of any tracked industry. Top-performing SaaS pages reach 8 to 15%.
The gap is rarely traffic. It is page design, intent matching, and friction.
2. The Low-Traffic Reality of B2B SaaS Sites
Most B2B SaaS pricing, demo, and product pages see only a few thousand monthly visits. The volume is too low for traditional A/B testing, which needs six to ten weeks per variant to reach statistical significance.
By the time results arrive, ad spend, market conditions, or seasonality have already shifted.
The practical answer is to combine three approaches in parallel:
- Heuristic analysis (expert review of the page)
- Behaviour data (attention, scroll, clicks)
- Incremental A/B tests on the highest-traffic surfaces only
This is the operating standard for high-performing B2B SaaS conversion programs today.
3. Behaviour Lenses Every SaaS Team Should Use
Behaviour data answers the question every conversion dashboard misses. Why a page converts. Not just whether it does.
Three lenses make this answerable on a typical SaaS page. Each lens maps to a specific tool and surfaces a specific friction signal.
Attention Maps
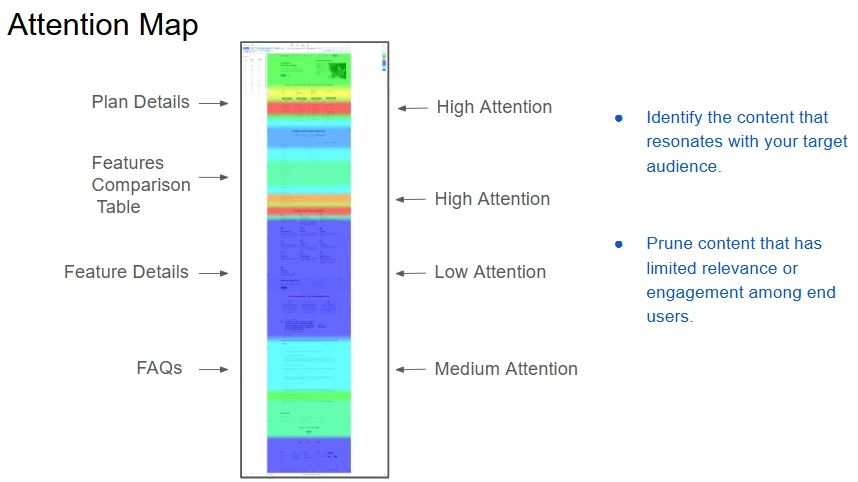
Attention maps show where visitors' eyes actually land. On a typical SaaS pricing page, plan cards and the feature comparison table draw the closest attention. FAQs and footer content draw the lowest.
The action is not to remove the FAQ. It is to surface what already resonates and remove what does not.
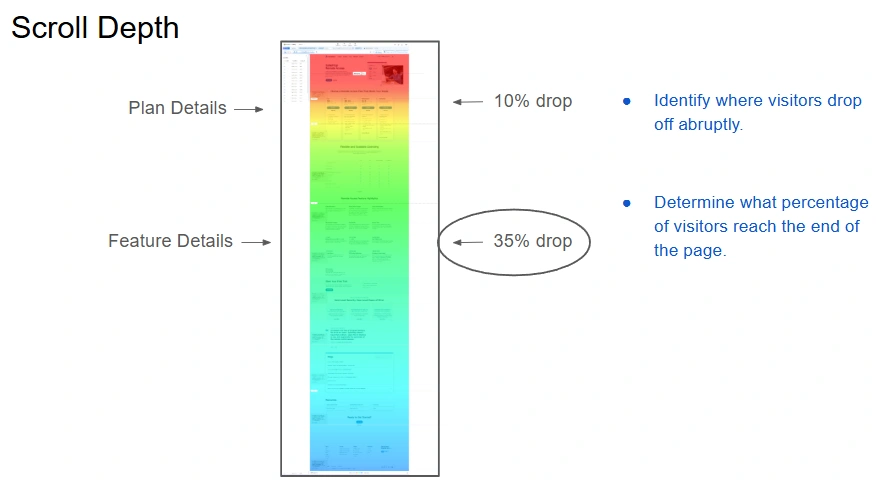
Scroll Depth
Scroll depth reveals where visitors abandon the page before reaching the conversion action. The most common pattern on B2B SaaS pages is a long scroll section, like a feature carousel or comparison block, that breaks down on mobile. Users hit it, struggle to engage with it, and bounce. The CTA sitting below never gets a chance.
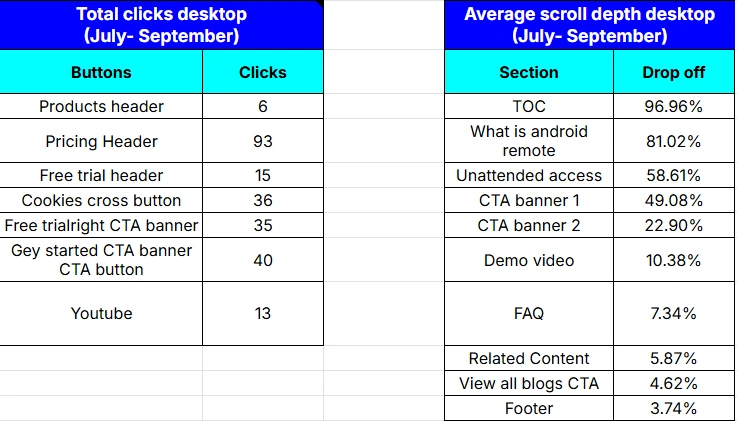
The fix is structural. Either tighten the long scroll section or move the primary CTA above it. Take Splashtop as an example. In a LeadWalnut CRO audit, only 49% of visitors reached the first CTA banner, and just 7% reached the FAQ. Restructuring the page flow lifted conversions in 30 days. Scroll drop-off above the CTA is almost always a UX problem, not a copy problem.
Clicks Distribution
Click maps show where visitors are clicking, and where they are not. The fix is rarely a different button colour. It is almost always about what surrounds the primary CTA.
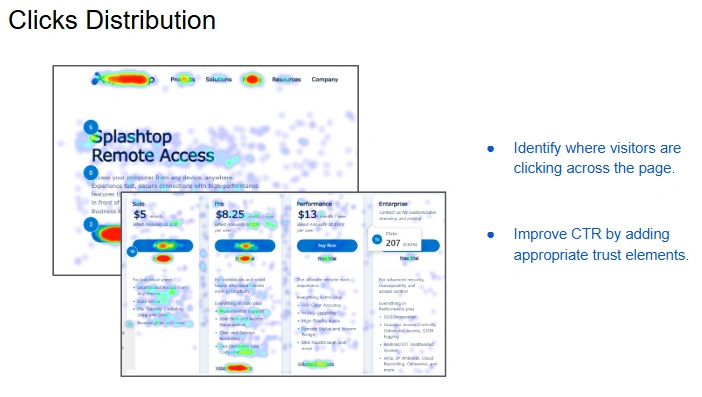
Hotjar's 2026 heatmap analysis of 17,500 landing pages across SaaS, retail, and media found that above-the-fold CTAs received 89% more clicks than below-the-fold equivalents.
Pages that paired strong placement with a value-proposition headline under ten words reached an average session-to-conversion rate of 11.3%. The conversion lever was not traffic. It was where the click lived on the page.
Take eFax as an example. Applying all three behaviour lenses to a single landing page surfaced the exact friction points: weak attention on the hero, scroll drop-off before the CTA, and competing clicks around the primary button. Restructuring the page based on those signals lifted conversions 48.7% in 30 days.
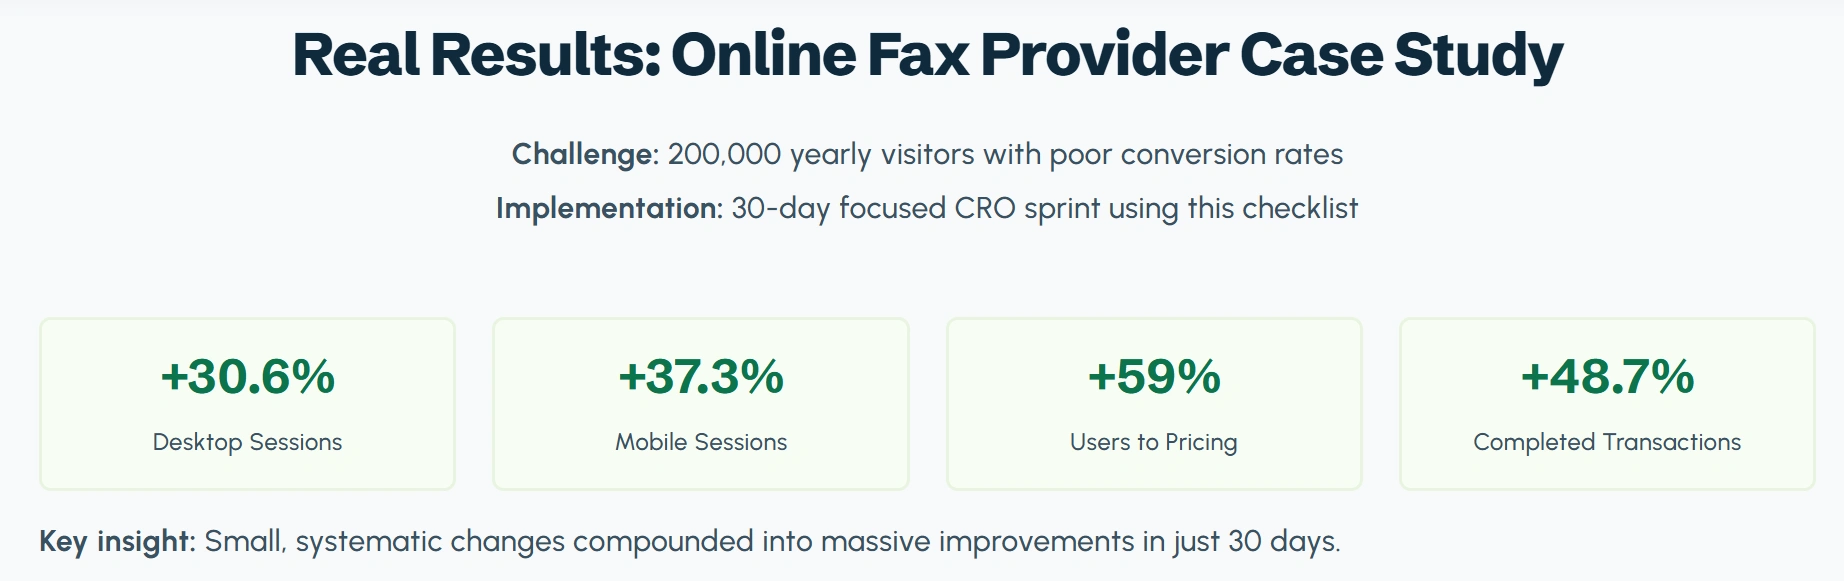
Explore the complete eFax case study.
A 6-Step Framework for SaaS Conversion Rate Optimization
A repeatable SaaS CRO cycle moves a team from page audit to deployed improvement in two weeks instead of one quarter. Each step has a defined input, a tool, and an output. That keeps the process measurable end-to-end.
The six steps below build on each other in sequence.
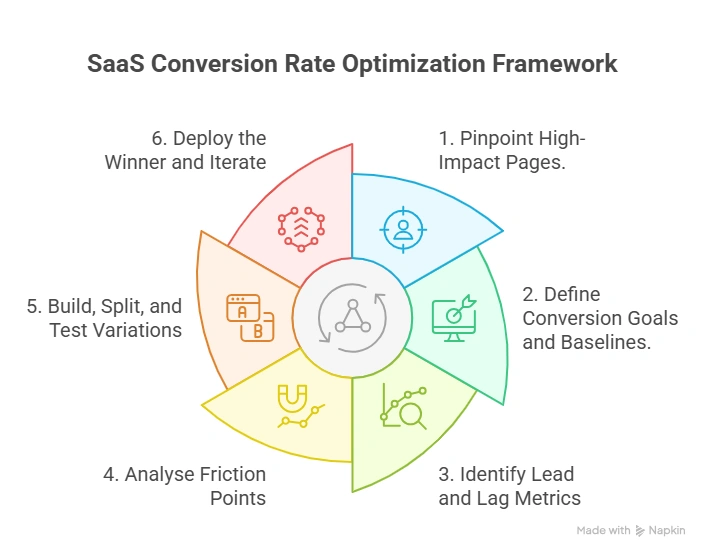
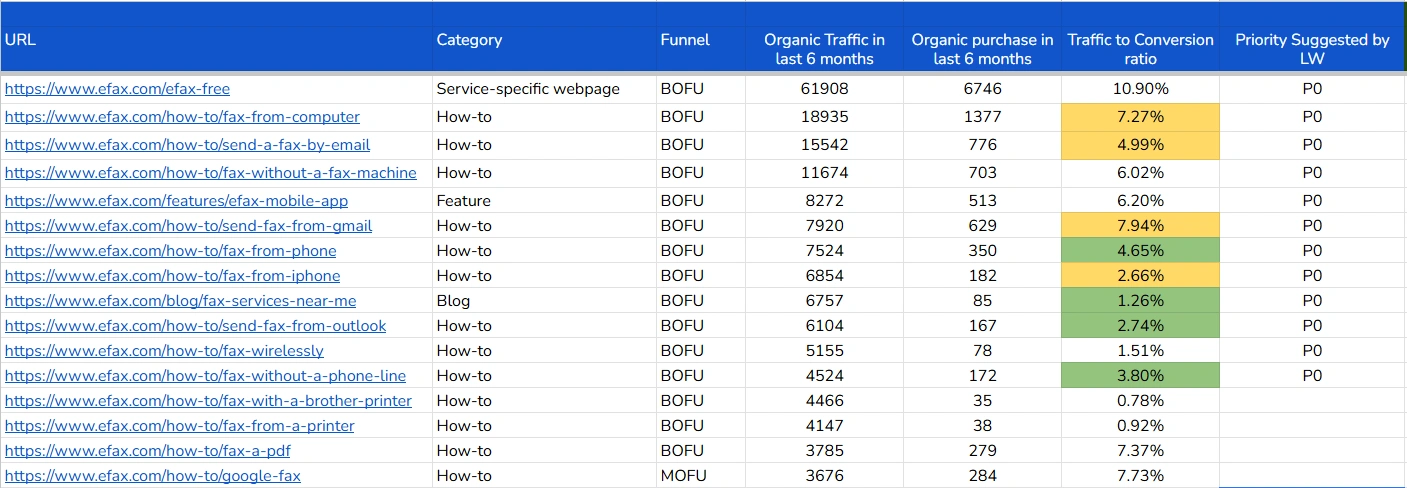
Step 1. Prioritize High-Impact Pages
Start where the pipeline is decided. Product pages, solutions pages, comparison pages, and pricing pages carry the highest intent in any SaaS funnel.
Before optimizing, confirm the right ICP segments are visiting. Segment GA4 traffic by industry, role, source, and device. Prioritize pages where qualified traffic meets weak conversion.
Step 2. Define Conversion Goals and Baselines
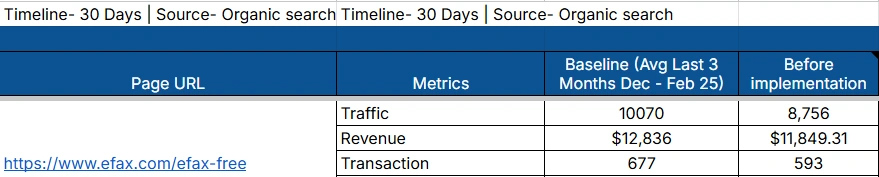
Pull six months of data per priority page. Set baselines for the three conversion events most SaaS sites care about: any trial signup, form submit, purchase & revenue.
Each page should anchor to one primary conversion goal, not five competing ones. Multiple goals dilute focus and inflate noise during testing.
Step 3. Identify Lead and Lag Metrics
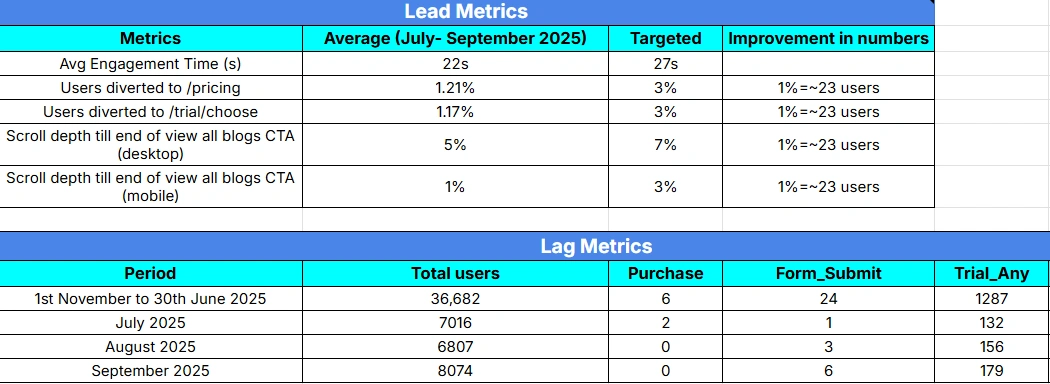
Lead metrics predict whether lag metrics will move. On a pricing page, lead metrics include scroll past 50%, time on plan card, and comparison-table interactions.
Lag metrics are trial signups, demo bookings, and form submits.
Tracking only lag metrics means waiting weeks to read a change. Lead metrics give a read inside a week.
Step 4. Analyze Friction Points With Behaviour Data
Use the three behaviour lenses to find where visitors hesitate, miss critical content, or click on dead elements.
Build a clear hypothesis per friction point. Example: "If users miss the plan comparison table, then surfacing it above the fold will lift trial starts."
Step 5. Build, Split, and Test Variations
Deploy variants with a random control-versus-variant traffic split using VWO or Optimizely. On low-traffic SaaS pages, stack the deck.
Make boldly different variants so the signal is stronger than the noise. Two variants that differ only by a button colour are statistically wasteful at low traffic.
Step 6. Deploy the Winner and Iterate
Push the winning variant. Monitor the same baseline metrics for four to six weeks. Re-enter Step 1 with a new hypothesis.
CRO is a continuous loop, not a one-time project. Every winning variant becomes the new control.
SaaS Landing Page CRO Tactics From Real Page Audits
Three tactics show up in nearly every successful SaaS landing page CRO project. Each is small enough to ship in a sprint. Each has a documented conversion lift backed by industry data or real outcomes.
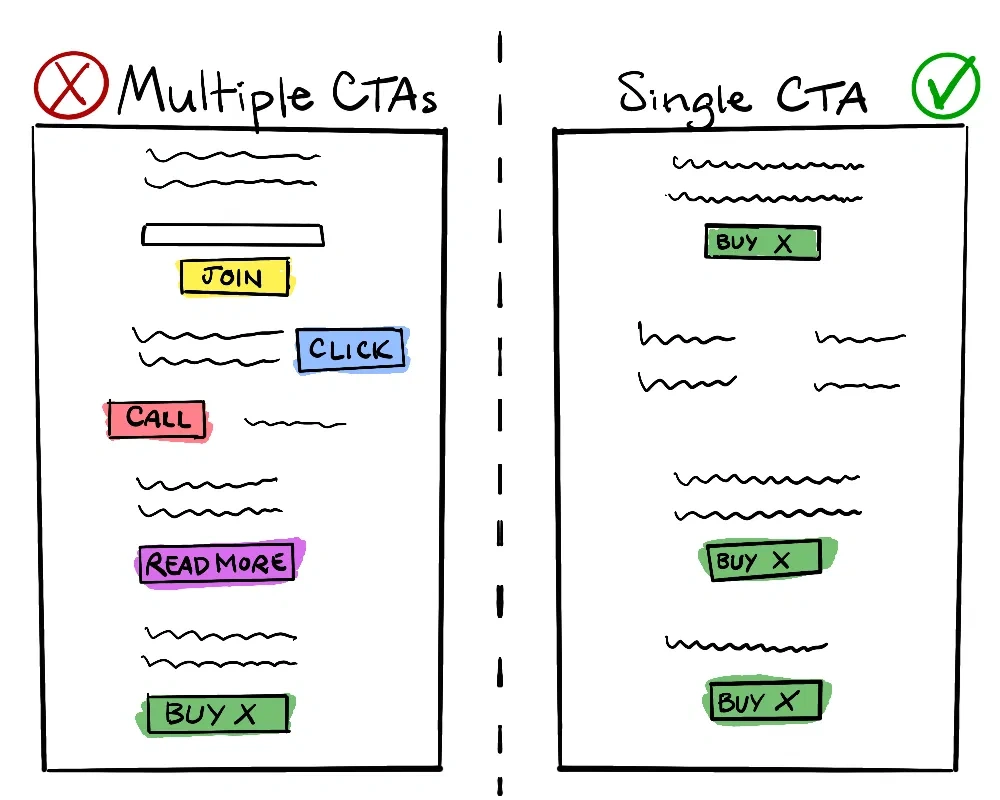
Too Many CTAs Mean Zero Decisions
The most important action on a SaaS page should not compete with five other links.
Five CTAs on one page — Learn More, Buy Now, Book a Call, Subscribe to Newsletter, Watch a Demo; each routing to a separate funnel destination is a conversion problem.
No single action carries enough weight to drive a decision. Intent gets distributed, and the page converts in none of the five directions it points to.
Lead With Plans and Feature Comparison
If attention concentrates on plans and the feature comparison table, lead with them above the fold. Push hero copy and long-form storytelling below.
The page does not need to argue. The buyer is already comparing. This is doubly true for visitors arriving via AI search. They land pre-educated and want to evaluate.
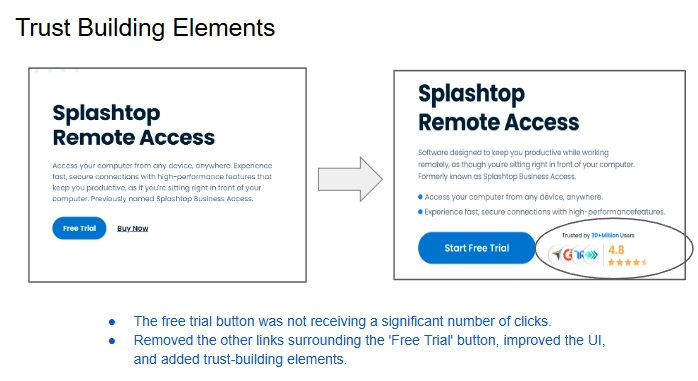
Surround the CTA With Trust Markers
The free-trial button rarely fails because of its label. It fails because nothing around it earns the click.
Customer logos, Clutch or G2 ratings, security badges, and a single named-customer quote next to the CTA consistently lift click-through. The right CTA design and placement make the difference between a button that gets seen and one that gets clicked.
According to ON24's 2025 Webinar Benchmarks Report, CTAs paired with personalization convert 48% higher than non-personalized ones. Trust signals must speak to the visitor's segment, not the homepage average.
Trust signals must speak to the visitor's segment, not the homepage average.
How GEO and AEO Are Reshaping CRO for B2B SaaS
GEO and AEO are pushing B2B SaaS sites into a new traffic profile. Fewer visitors per month. Visitors with sharply higher purchase intent.
SaaS CRO has to absorb that shift.
AI Search Visitors Convert Differently
Visitors arriving from AI engines have usually already seen a summarised version of the offering.
They land deeper in the funnel, often on a pricing or comparison page rather than the homepage.
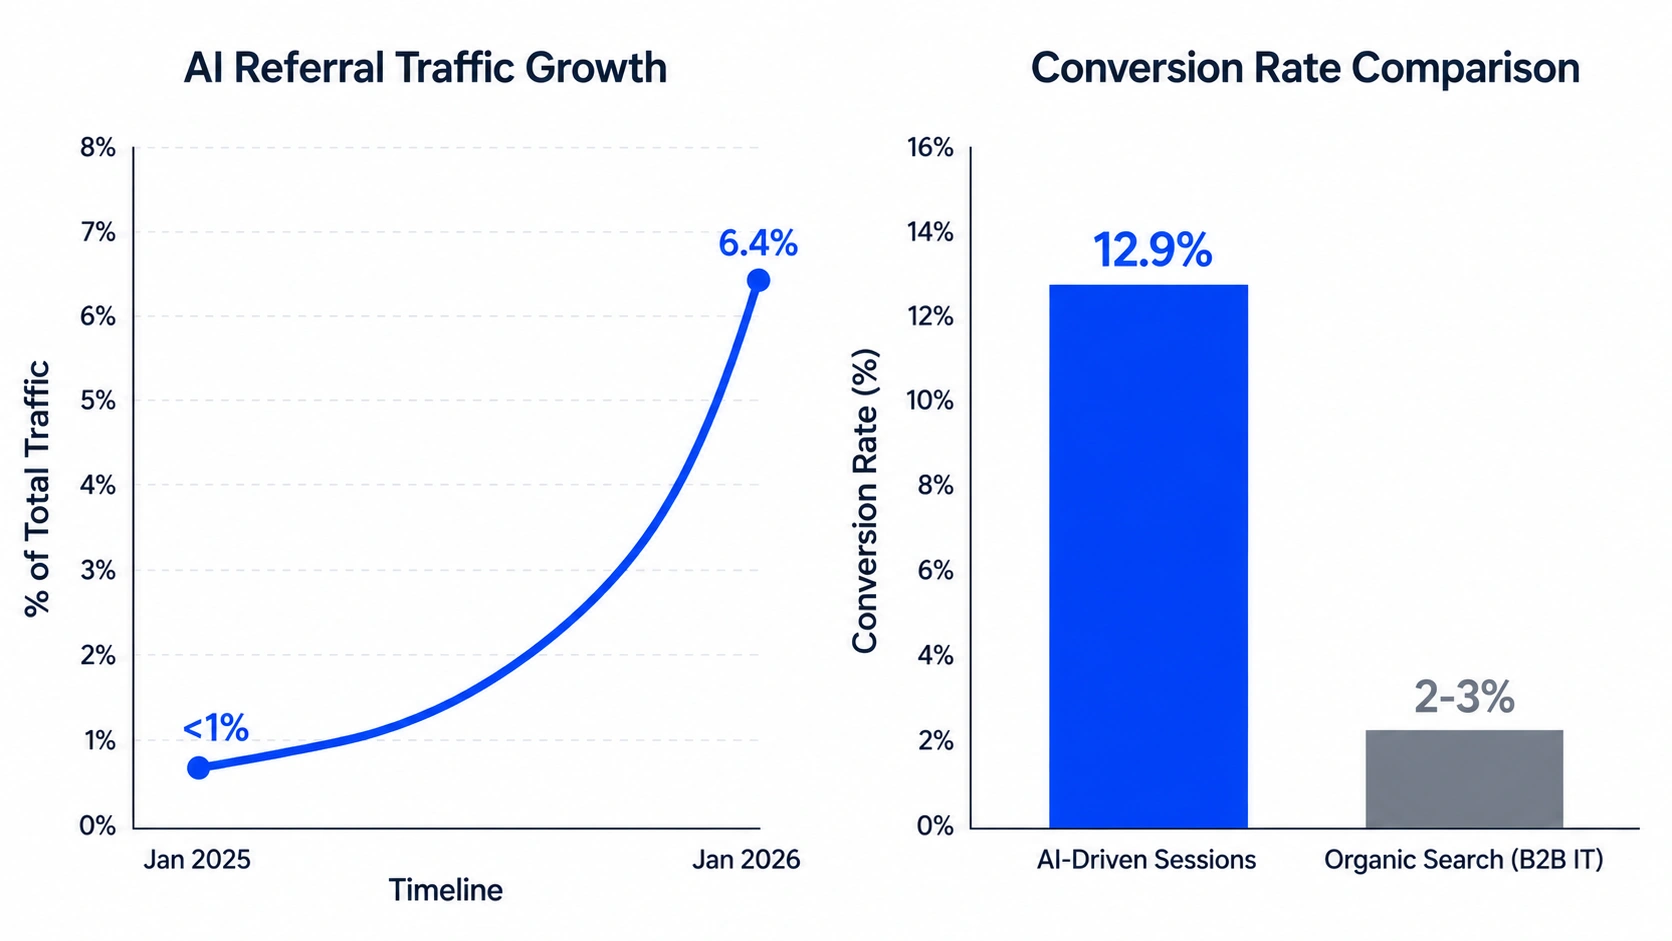
Opollo's 2026 AI Search Benchmark Report found AI referrals grew from less than 1% of total traffic in January 2025 to 6.4% by January 2026. The report also found AI-driven sessions converted at an average rate of 12.9%. Typical organic search in B2B IT markets converts at 2 to 3%.
Three implications for CRO follow:
On-Page Personalization Becomes Table Stakes
A pricing page should not show the same hero, comparison table, and CTA to a 50-person startup and a 5,000-person enterprise.
Firmographic personalization, using reverse-IP lookup paired with rules-based hero swaps, is now table stakes in 2026.
McKinsey's research on personalization at scale found that companies that excel at personalization generate 40% more revenue from those activities than average performers.
Before optimising for GEO and AI visibility, get the foundation right:
- Map the funnel stage to the right pages
- Define page intent for each conversion surface
- Understand audience behaviour through data
- Clear on-page hygiene of friction
Personalization without this foundation is decoration on a broken page.
3 CRO Priorities Marketing Leaders Must Own in 2026
For CMOs and growth leaders, three CRO priorities have the highest revenue impact in 2026.
CRO is a discipline, not a project. Small, repeated wins compound on the same traffic base.
That is what makes conversion rate optimization one of the highest-leverage growth levers available to a B2B SaaS team in 2026.
How to Ship CRO Like You Ship Code
High-performing B2B SaaS teams treat CRO like a product sprint, not a quarterly project. Four rules keep the program compounding.
Rule 1: Ship one change every 2 to 4 weeks. One tested change per sprint beats one A/B test per quarter.
Rule 2: Install behaviour data before touching the page. GA4, Microsoft Clarity, and Hotjar must be live before any change ships.
Rule 3: Refresh trust signals every quarter. Logos, certifications, and customer quotes go stale. Update them before they stop converting.
Rule 4: Expect some changes to fail. Half of all variants will not move the baseline. Ship fast enough that being wrong is cheap.
LeadWalnut has run this loop across 100+ B2B SaaS audits, including Fortinet, Splashtop, and eFax, and is rated 4.9 out of 5 on Clutch by US-based clients.
FAQ
What tools are used for B2B SaaS CRO?
Most B2B SaaS CRO programs run on three layers. GA4 for funnel and event tracking. Microsoft Clarity or Hotjar for behaviour data including attention maps, scroll depth, and click distribution. VWO or Optimizely for split testing and variant deployment.
How long does an A/B test take on a B2B SaaS website?
A/B test duration depends on page traffic and the size of the change being tested. Most B2B SaaS pages need three to four weeks for a single variant to produce a readable result. Bolder variants on higher-traffic pages reach significance faster than subtle ones on low-traffic surfaces.
What is a good conversion rate for a B2B SaaS website?
A good conversion rate for a B2B SaaS website depends on page type and traffic source. Pricing and demo pages convert higher than blog or homepage traffic. Visitors from AI search and direct organic search typically convert at a higher rate than paid traffic.
Should B2B SaaS companies hire a CRO agency or build CRO in-house?
It depends on traffic volume and in-house experimentation maturity. Teams without senior CRO talent usually scale faster with a specialist agency. Mature teams often run a hybrid model where the agency owns strategy and the in-house team owns the execution.
What is the biggest mistake B2B SaaS teams make with CRO?
The biggest mistake is treating CRO as a quarterly project tied to a website redesign. Real conversion lifts come from continuous, sprint-based testing on existing pages, not from periodic large-scale rebuilds.
.png)


How can LeadWalnut help?

Related Articles
Which AI Writing Tools Earn a Citation in 2026?
How to Earn Citations from High-Authority Publications