Landing page conversion rate is the percentage of visitors who complete the one action a landing page was built for. For B2B SaaS teams, that action is usually a demo request, a free trial or a gated download.
The problem is the number most teams compare against. All-industry averages blend ecommerce, events and lead generation, and say little about a B2B demo page. Demo, trial and content pages convert at very different rates, and so do paid, organic and email traffic.
This guide explains how to calculate landing page conversion rate, what a good rate looks like by page type in 2026, and the practices that turn more visitors into pipeline.
What Is a Landing Page Conversion Rate?
A landing page conversion rate is the share of visitors to a specific page who complete its primary goal. It is a page-level metric, tied to one offer and one call to action.
Each landing page should have a single conversion goal. A demo page asks for a meeting. A trial page asks for a signup. A webinar page asks for a registration. When one page tries to do all three, the rate stops meaning anything.
The rate also measures a promise kept. Every visitor arrives from an ad, an email, a search result or an AI answer, and that source made a promise. The landing page conversion rate shows how well the page delivers on it. A low rate often signals a broken promise, not a bad offer.
Landing Page Conversion Rate vs Sitewide Conversion Rate
The two metrics share a name but answer different questions.
Sitewide rates almost always run lower. Most blog readers are not ready to buy, yet each one counts as a visitor. That is why a sitewide figure should never serve as a landing page benchmark.
How to Calculate Landing Page Conversion Rate
To calculate landing page conversion rate, divide conversions by unique visitors and multiply by 100.
The Conversion Rate Formula, With a Worked Example
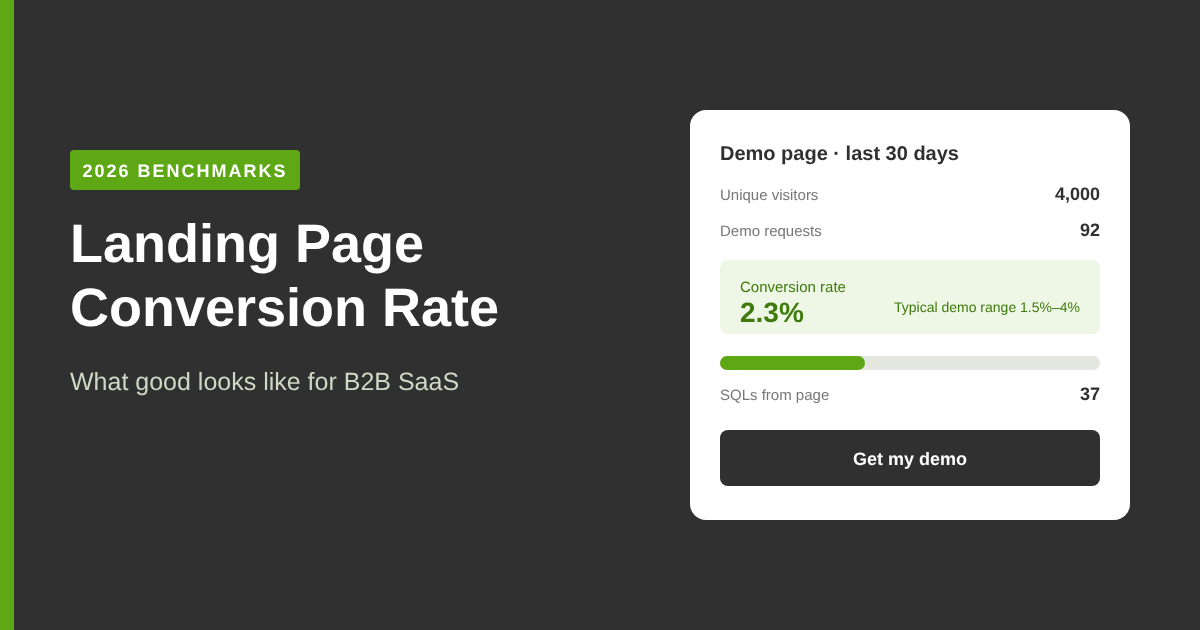
A demo page receives 4,000 unique visitors in a month and generates 92 demo requests. Its landing page conversion rate is (92 ÷ 4,000) × 100 = 2.3%.
Unique Visitors or Sessions: Choosing the Right Denominator
Sessions count every visit, so one buyer who returns three times counts three times. Unique visitors count people. For landing pages, unique visitors give the truer picture, because B2B buyers often return before they convert. Whichever is chosen, keep one definition and one fixed date range across every page.
Which B2B SaaS Actions Should Count as a Conversion
Common conversions are demo requests, free trial signups, gated asset downloads and webinar registrations. Raw form fills tell only half the story. Track a pipeline-qualified conversion alongside them, such as a sales-qualified lead (SQL) or a demo that passes lead scoring.
Calculating Conversion Rates at Each Funnel Step
A single blended rate hides where a page leaks. Splitting it into steps shows the weak point:
In this example, the form is the problem. Most visitors who start it never finish.
How to Track Landing Page Conversions in GA4 and Your CRM
- Mark each form submission as a key event in GA4, named by offer (for example, demo_request).
- Tag every campaign link with consistent UTM parameters for source, medium and campaign.
- Capture the landing page URL and UTM values in hidden form fields.
- Pass those fields into the CRM, so each lead keeps its first page and channel.
- Report SQLs and opportunities by landing page, not just form fills.
What Is a Good Conversion Rate for a B2B SaaS Landing Page?
A good landing page conversion rate is one above the median for that page type and traffic channel. There is no single universal number. Three examples show why:
- Demo request page: 4% from paid search is solid, because a demo asks for time and commitment.
- Free trial page: 10% is reasonable, because signing up costs the visitor little.
- Gated content page: 2% can be healthy for an ebook promoted to a cold audience.
So is 12% good? For a demo page, 12% is strong. For a newsletter signup page, it is only average, since the ask is tiny.
What counts as low? A page sitting well below its own page-type range is underperforming. So is a page whose rate falls quarter over quarter, even if it still looks fine against an industry average.
B2B SaaS Landing Page Conversion Benchmarks for 2026
Landing page conversion rate benchmarks are most useful when split by page type. The ranges below are directional, drawn from published B2B SaaS analyses, and should be refined with each team's own data.
Teams building a wider program can start with this guide to CRO for B2B SaaS.
Benchmarks by Page Type: Trial, Demo, Feature and Content
Trial pages convert highest because the commitment is low: an email address and a few minutes. Demo pages ask for a meeting with sales, so fewer visitors say yes. Gated content converts lowest because visitors are early in research and guard their contact details.
Benchmarks by Traffic Channel
Paid search and branded traffic usually outperform cold organic and paid social, often by 1.5 to 3 times. Email and retargeting audiences convert higher still, because they already know the brand. Benchmark each page by channel, not as one blended figure. A blended rate can rise simply because the traffic mix changed.
Why B2B SaaS Sits Below the All-Industry Median
B2B SaaS pages often sit below that figure. Buying cycles run for months, several people share the decision, and the main offer, a demo, asks for real commitment. A lower rate is normal. A lower rate than similar pages is the real problem.
6 Landing Page Factors That Influence B2B SaaS Conversions
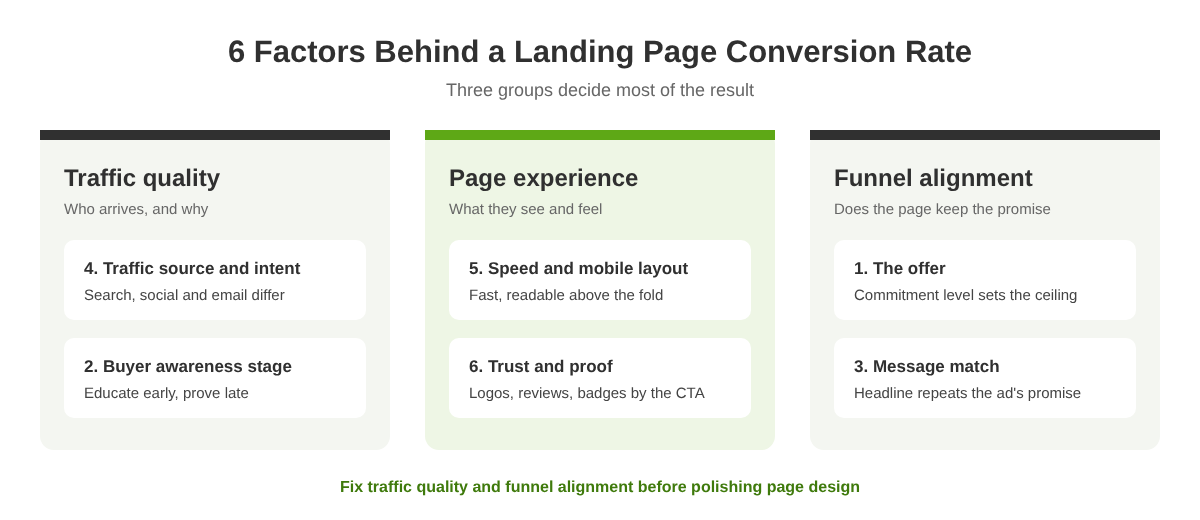
Six factors decide most of a page's conversion rate. They fall into three groups: traffic quality, page experience and funnel alignment.
1. The Offer
A demo, a trial and an ebook carry different levels of commitment, and that commitment sets the ceiling for the rate. Signal to check: does the offer match what the visitor is ready to give at this stage?
2. Buyer Awareness Stage
Early-stage visitors need education before a demo ask. Late-stage visitors want pricing, integrations and proof. Signal to check: does the page speak to the stage the traffic is actually in?
3. Message Match
The headline must repeat the promise of the ad, email or search result that sent the visitor. Any gap creates doubt within seconds. Signal to check: read the ad and the headline side by side.
4. Traffic Source and Intent
High-intent search traffic behaves differently from cold social traffic, and one page rarely serves both well. Signal to check: compare conversion rates by channel for the same page.
5. Page Experience and Speed
Slow loads, cramped mobile layouts and dense copy above the fold push visitors away before they read the offer. Signal to check: mobile load time and the mobile conversion rate.
6. Trust and Proof
Customer logos, reviews, compliance badges and case results reassure buyers at the moment of decision. Signal to check: is proof visible next to the CTA, or buried at the bottom?
How to Improve Landing Page Conversion Rate: 5 Best Practices
These five practices form one repeatable cycle. Teams that want to increase landing page conversion rate should run them in order, then repeat.
1. Segment Traffic by Channel and Intent
Each channel brings a different visitor. Build separate pages or variants for paid search, paid social and email, each matched to its source. Search visitors want a direct answer to their query. Social visitors need more context first. Email subscribers already know the brand. Never send paid traffic to the homepage, where navigation and competing messages dilute the one action that matters.
2. Find Drop-Off Points With Heatmaps and Scroll Data
Before changing anything, find where visitors leave. Heatmaps show where they click, scroll depth shows how far they read, and session recordings show where they hesitate. Microsoft Clarity provides all three for free. The section where scroll depth drops sharply is usually the first fix. An AI-led audit such as LeadWalnut's CRO AI Agent can shorten this diagnosis.
3. Sharpen the Headline, Offer and Primary CTA
Lead with the outcome the buyer wants, not a list of features. Place one primary CTA above the fold, written as an action, such as "Get my demo" rather than "Submit." Then check the attention ratio: the number of possible actions on the page against the one that matters. Every navigation link and secondary CTA competes for attention. The fewer the options, the clearer the choice.
4. Reduce Form Friction and Place Proof Near CTAs
Keep forms to five fields or fewer where possible. For longer qualification, use a multi-step form that opens with easy questions and saves harder ones for later. Place customer logos, review ratings or compliance badges beside the submit button, where doubt peaks. Each field removed and each proof point added lowers the cost of saying yes.
5. Test, Measure Pipeline Yield and Iterate
Run A/B tests for at least three to four weeks to cover full business cycles. Aim for about 100 conversions per variation and 95% confidence before calling a winner. Many B2B pages lack that traffic. For them, make sequential changes and measure each against a stable baseline. Judge every result on SQLs and opportunities, not only form fills.
Why Landing Pages Fail to Convert: Common CRO Mistakes
- Benchmarking against all-industry averages: a demo page judged against ecommerce data will look broken or brilliant for the wrong reasons.
- Competing CTAs: two or three equal buttons split attention and lower the rate of each.
- Sending paid traffic to the homepage: paid clicks land on a page built for everyone, not for the ad's promise.
- Ignoring mobile: many first visits happen on a phone, and a cramped form loses them.
- Calling tests too early: a one-week winner often fades once the full buying cycle plays out.
For the next layer of fixes, these CRO tactics for enterprise SaaS go deeper.
Landing Page Conversion Optimization in the Age of AI
AI is changing landing page conversion optimization in two ways. First, more visitors arrive from AI answers in ChatGPT, Perplexity and Google AI Overviews. They have already compared options, so they expect the page to confirm what the AI told them, with clear pricing signals, specific proof and a fast path to action.
Second, AI tools are shrinking the gap between spotting a leak and fixing it. Heatmap analysis, copy variants and page drafts that once took weeks can now take hours. Landing page conversion rate optimization still depends on judgment, but the cycle runs faster. Track AI referral traffic as its own channel, because these visitors often convert differently from search or social.
What Marketing Leaders Should Track Beyond Conversion Rate
For CMOs and VPs of Marketing, conversion rate is an input, not the outcome. Four metrics show whether a landing page earns its budget:
- SQL rate per landing page: the share of conversions that sales accepts.
- Cost per opportunity: spend divided by opportunities created from the page.
- Pipeline yield: pipeline value generated per 1,000 visitors.
- Conversion by device: mobile and desktop rates side by side.
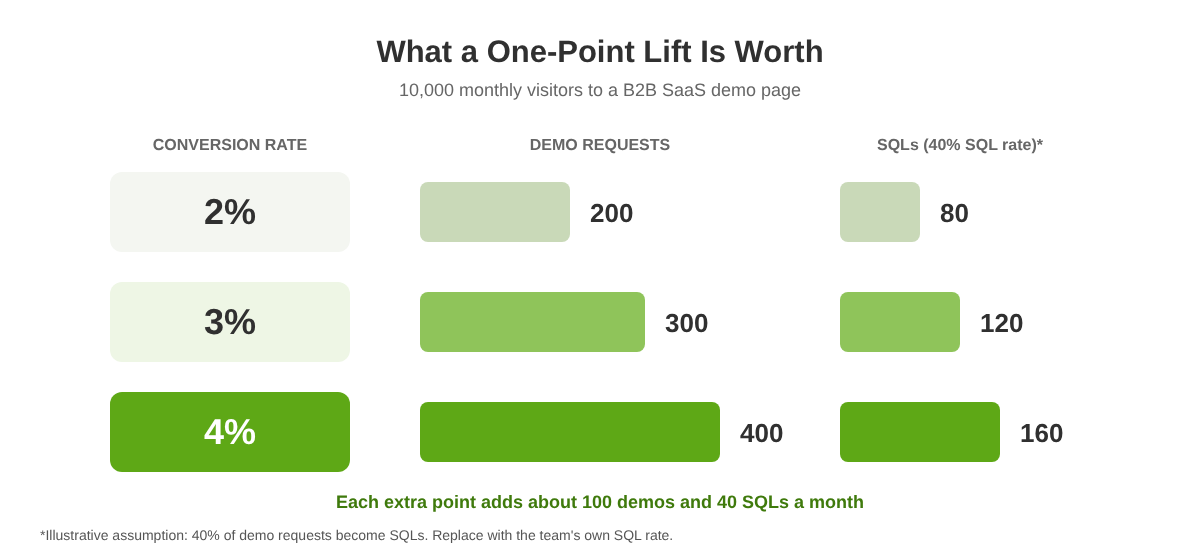
A demo page converting at 2% that produces SQLs beats a 6% page whose leads never reach sales. This CRO framework session shows how to set those targets.
Build Landing Pages That Turn Traffic Into Pipeline
High-converting landing pages follow a simple discipline. Benchmark each page by type and channel, not against an all-industry figure. Calculate the rate the same way every time. Fix the largest drop-off first, then test the next. Measure success in SQLs and pipeline, not form fills alone.
LeadWalnut's free CRO AI Agent and Landing Page Builder AI Agent put this workflow into practice, from diagnosis to an editable page. The same approach lifted eFax's completed transactions by 48.7% in 30 days. Teams that want hands-on support can explore LeadWalnut's conversion rate optimization services.
FAQ
Is a 12% conversion rate good for a landing page?
It depends on the ask. For a B2B demo page, 12% sits far above typical ranges, so it is worth confirming that tracking is clean and that the traffic is not mostly warm retargeting. For low-commitment offers such as newsletters, 12% is close to normal.
What is the average landing page conversion rate by industry?
Rates vary widely by industry. Categories with low-commitment consumer offers tend to sit at the top of cross-industry studies, while B2B software and professional services sit lower. Treat industry averages as context, not as targets.
Should paid and organic traffic go to the same landing page?
Usually not. Paid campaigns perform best on dedicated pages with no navigation and exact message match, while organic pages also need enough content to rank. A shared page can work for branded search, where intent is already high.
How often should B2B SaaS teams review landing page conversion rates?
Check high-traffic pages weekly for sudden drops, such as a broken form or tracking tag. Review trends monthly and benchmarks quarterly, since long B2B buying cycles make shorter windows noisy.
How much traffic does a landing page need to measure conversion rates accurately?
As a rule of thumb, wait for at least 1,000 unique visitors and 30 conversions before treating a rate as stable. Below that, a handful of extra form fills can swing the rate by whole percentage points.



How can LeadWalnut help?

Related Articles
Landing Page Conversion Rate: Benchmarks for B2B SaaS
How AI Answer Engines Choose Which Product Pages to Cite